AI KPIs for Property Management: 20 Benchmarks for 2026
Discover 20 AI KPIs for property management with definitions, formulas, and 2026 benchmarks. Build a dashboard and prove ROI—see the metrics to track.

TL;DR
AI adoption in property management jumped from 21% to 34% in just one year, but most operators still measure success with pre-AI metrics. This guide covers 20 AI KPIs property management teams need, organized into three tiers: AI-native metrics that didn’t exist before (like triage accuracy and containment rate), traditional metrics with new AI-era benchmarks (like lead response time dropping from hours to seconds), and business-outcome KPIs that ownership actually cares about. Every metric includes a pre-AI baseline, a post-AI benchmark, and a formula or definition so you can build a dashboard that proves ROI.
Quick Answer: Which AI KPIs Should Property Managers Track?
Property managers should track AI KPIs across four areas: AI-native performance, leasing performance, maintenance performance, and financial outcomes. The most important starting metrics are lead response time, lead-to-lease conversion, AI automation rate, maintenance triage accuracy, containment rate, maintenance resolution time, occupancy, tenant retention, and AI ROI. Start with 3–5 KPIs per workflow and compare every result against a pre-AI baseline.
The 9 KPIs to Start With
KPI | Primary Purpose | Recommended Starting Point |
|---|---|---|
Lead Response Time | Measure leasing speed | Under 60 seconds |
Lead-to-Lease Conversion | Measure leasing effectiveness | Compare against your pre-AI baseline |
After-Hours Capture Rate | Measure missed-lead recovery | Track toward 90%+ |
AI Automation Rate | Measure hands-off workflow completion | Establish baseline first |
Triage Accuracy | Measure maintenance classification quality | 90%+ target |
Containment Rate | Measure avoided vendor dispatches | Establish baseline first |
Mean Time to Resolve | Measure maintenance efficiency | Reduce from baseline |
Tenant Retention Rate | Measure downstream resident impact | Compare against pre-AI cohort |
AI ROI Multiple | Measure financial return | Target positive ROI before scaling |
Why Your Old KPIs Don’t Work Anymore
The moment you plug AI into your leasing or maintenance workflows, two things happen. First, entirely new metrics appear, things like triage accuracy and containment rate that had no equivalent in a manual world. Second, the baselines on traditional metrics shift so dramatically that your old benchmarks become meaningless. A “good” lead response time used to be measured in hours. Now it’s measured in seconds.
This matters because 77% of operators already using AI report moderate to significant reductions in operating expenses, and 85% have seen measurable improvements in lead-to-lease conversion rates. But you can’t claim those wins without the right measurement framework.
The biggest mistake? Deploying AI without pulling baseline data first. Establish your current numbers across at least 90 days before flipping the switch. If you don’t have pre-AI numbers, you can’t demonstrate ROI to ownership, and you can’t hold vendors accountable.
This guide organizes AI KPIs for property management into three tiers, each building on the last.
Explore Haven’s AI property management software to see how these metrics get tracked automatically.
What Are AI KPIs in Property Management?
AI KPIs in property management are measurable indicators used to evaluate how artificial intelligence affects leasing, maintenance, resident communication, automation, operating costs, and financial performance. Unlike traditional property management metrics, AI KPIs also measure capabilities such as response speed, triage accuracy, containment, automation, and AI-assisted resolution.
At-a-Glance: AI KPI Quick-Reference Table
# | KPI | Category | Pre-AI Baseline | Post-AI Benchmark | Why It Matters |
|---|---|---|---|---|---|
1 | Triage Accuracy Rate | AI-Native (Maintenance) | N/A | 90%+ | Prevents wrong-priority dispatches |
2 | Containment Rate | AI-Native (Maintenance) | N/A | 15–25% | Reduces unnecessary vendor costs |
3 | After-Hours Capture Rate | AI-Native (Leasing/Maintenance) | ~0% (voicemail) | 90%+ | 49% of leads arrive after hours |
4 | AI Automation Rate | AI-Native (All) | N/A | 60–80% | Measures true hands-off resolution |
5 | False Emergency Rate | AI-Native (Maintenance) | N/A | Under 5% | Cuts after-hours vendor spend |
6 | Lead Response Time | Leasing | Hours to days | Under 60 seconds | 40% engagement at 1–2 min vs. 10% at 30 min |
7 | Lead-to-Lease Conversion | Leasing | 8.7% | 15–30%+ | Direct revenue driver |
8 | Days on Market | Leasing | 20–30 days | 4+ days faster | Each vacant day costs $45–$75 |
9 | Cost Per Lease | Leasing | Varies widely | 30–50% lower | Captures staff time and marketing savings |
10 | Tour Show Rate | Leasing | 40–60% | 70–85% | AI confirmations reduce no-shows |
11 | First Response Time | Maintenance | 4.6 days | Under 18 hours | Tenants resolved in 24 hrs renew at higher rates |
12 | Mean Time to Resolve | Maintenance | Property-specific | 25–40% reduction | Satisfaction and retention driver |
13 | Maintenance Cost Per Unit | Maintenance | $800–$1,500/yr | 15–20% lower in Year 1 | Protects NOI directly |
14 | Vendor Dispatch Speed | Maintenance | Hours to days | Under 30 minutes | Prevents damage escalation |
15 | Recurring Issue Rate | Maintenance | Property-specific | Declining trend | Measures first-time fix quality |
16 | Net Operating Income | Financial | Portfolio-specific | 3.7–5.2% annual increase | The north-star metric |
17 | Occupancy Rate | Financial | 90–95% typical | 1–3 pp improvement | Lagging indicator of upstream AI wins |
18 | Tenant Retention Rate | Financial | Property-specific | 15–20 pp higher | Avoids $2K–$5K turnover cost per unit |
19 | Tenant Satisfaction Score | Financial | 72% average | 85–94% | Predicts retention and referrals |
20 | AI ROI Multiple | Financial | N/A | 3x–10x return | Justifies continued investment |
Now, the detail behind each one.
Which AI KPIs Should a Property Management Company Track?
The right AI KPI depends on where the property management operation is losing money or staff time. Do not start by tracking all 20 metrics. Start with the workflow that has the largest measurable operational problem.
Business Problem | KPIs to Prioritize |
|---|---|
Missed leasing inquiries | Lead Response Time, After-Hours Capture Rate, Lead-to-Lease Conversion |
Low leasing conversion | Lead Response Time, Tour Show Rate, Lead-to-Lease Conversion |
High vacancy | Days on Market, Lead-to-Lease Conversion, Occupancy Rate |
Excessive maintenance costs | Containment Rate, Maintenance Cost Per Unit, Recurring Issue Rate |
Too many emergency dispatches | Triage Accuracy, False Emergency Rate, Vendor Dispatch Speed |
Slow maintenance response | First Response Time, Vendor Dispatch Speed, Mean Time to Resolve |
High tenant turnover | Mean Time to Resolve, Tenant Satisfaction, Tenant Retention |
AI investment is difficult to justify | AI Automation Rate, Cost Per Lease, Maintenance Cost Per Unit, AI ROI Multiple |
Staff spending too much time on repetitive work | AI Automation Rate, Containment Rate, After-Hours Capture Rate |
Ownership wants financial proof | NOI, Occupancy, Tenant Retention, AI ROI Multiple |
Rule of thumb: choose 3–5 KPIs for each AI-enabled workflow, then connect those operational metrics to one business outcome such as NOI, occupancy, retention, or cost reduction.
Leading vs. Lagging AI KPIs in Property Management
Not every AI KPI should be reviewed on the same schedule. Leading indicators show whether an AI workflow is working before the financial results appear. Lagging indicators show whether those operational improvements ultimately affected the property or portfolio.
KPI Type | Examples | Typical Review Cadence | Purpose |
|---|---|---|---|
AI execution | Automation Rate, Triage Accuracy | Weekly | Verify AI is performing correctly |
Operational | Response Time, Dispatch Speed, MTTR | Weekly | Identify workflow bottlenecks |
Leasing | Conversion, Show Rate, Days on Market | Weekly/Monthly | Measure leasing performance |
Resident | Satisfaction, Retention | Monthly/Quarterly | Measure resident outcomes |
Financial | NOI, Maintenance Cost, AI ROI | Monthly/Quarterly | Measure business impact |
The key principle is to connect leading indicators to lagging outcomes. For example, faster lead response should influence conversion, higher conversion should reduce vacancy, and lower vacancy should improve NOI. This creates an AI KPI chain rather than a collection of disconnected dashboard numbers.
Tier 1: AI-Native KPIs (Metrics That Didn’t Exist Before AI)
These are performance indicators that only become measurable once AI handles part of your workflow. No manual process generates this data. If you’re evaluating AI vendors, ask them which of these they report on natively.
1. Triage Accuracy Rate
Best for: Measuring whether your maintenance AI correctly classifies issue severity.
Formula: (Correctly classified requests ÷ Total AI-triaged requests) × 100
Target: 90%+
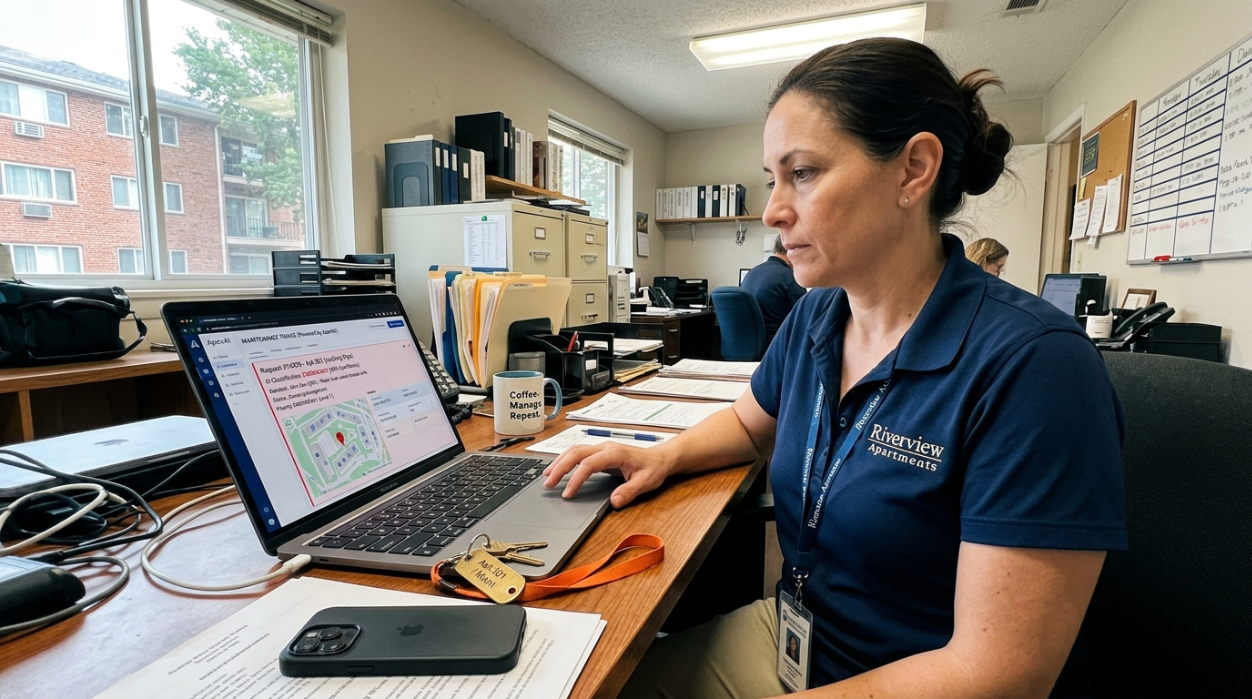
When a tenant calls about a leaking pipe at 2 AM, the AI needs to distinguish between a slow drip under the kitchen sink and a burst pipe flooding the unit. Triage accuracy measures how often it gets that classification right. Below 90%, you’re either missing real emergencies or dispatching vendors unnecessarily for non-urgent issues.
An AI maintenance coordinator should log every triage decision alongside the eventual human confirmation, giving you an auditable accuracy trail.
How to improve it: Feed misclassified tickets back into AI training. Most accuracy gaps come from vague tenant descriptions, so AI that asks follow-up questions before classifying will outperform AI that guesses from a single sentence.
2. Containment Rate
Best for: Tracking how often AI resolves routine issues without dispatching a vendor.
Formula: (Issues resolved by AI troubleshooting ÷ Total routine maintenance requests) × 100
Target: 15–25%
Not every maintenance request needs a technician. A tenant whose garbage disposal won’t turn on might just need to press the reset button. Containment rate measures how often AI-guided troubleshooting walks the resident through a fix, eliminating the vendor call entirely. The benchmark range of 15–25% means roughly one in five routine requests gets resolved at zero cost.
Practitioners on Reddit frequently cite vendor dispatch as the feature that justifies the cost of an AI answering service, but containment, the requests that never need dispatch, is where the real savings compound. If you’re paying $394 per average repair, every contained request saves that full amount.
3. After-Hours Capture Rate
Best for: Quantifying how many evening, weekend, and holiday inquiries your AI actually handles vs. losing to voicemail.
Formula: (After-hours interactions handled by AI ÷ Total after-hours inbound contacts) × 100
Target: 90%+
Pre-AI baseline: Effectively zero. Phone calls go to voicemail outside business hours, which matters because 49% of all leads come in after hours. Over 60% of calls to multifamily properties go unanswered during business hours too, according to a Digible analysis of 170,825 calls. After hours, that number approaches 100% without AI.
A single missed leasing call can represent $15,000 to $30,000 in annual rent lost. This KPI tells you whether your AI is actually capturing that value or whether prospects are still hitting voicemail and calling the next listing.
For a deeper look at the ROI math behind 24/7 availability and retention, that guide breaks down the financial case in detail.
4. AI Automation Rate
Best for: Measuring what percentage of interactions are fully resolved without human handoff.
Formula: (Interactions completed by AI without human intervention ÷ Total interactions) × 100
Target: 60–80% for routine workflows
This is the single most important efficiency metric. A high automation rate means your team is only handling exceptions, complex negotiations, and sensitive situations rather than repeating the same answers to the same questions.
But here’s the warning practitioners on Reddit stress: the biggest failure with AI leasing tools isn’t AI quality but bad workflow orchestration. If your AI responds instantly but the lead then sits in a queue for a human callback, you haven’t actually fixed the problem. Your automation rate might look good on paper while your actual experience falls apart at the handoff point. Track the end-to-end resolution, not just the AI’s portion.
5. False Emergency Rate
Best for: Measuring unnecessary after-hours vendor dispatches triggered by AI misclassification.
Formula: (Non-emergency issues dispatched as emergencies ÷ Total emergency dispatches) × 100
Target: Under 5%
False emergencies are expensive. An after-hours plumber dispatch for a non-urgent issue can cost $300–$500 in overtime fees alone. This KPI is the inverse complement of triage accuracy, specifically focused on the most costly error type. Track it separately because the financial impact of a false emergency far exceeds the impact of a missed non-urgent classification.
Tier 2: AI-Transformed Leasing KPIs
These metrics existed before AI, but AI shifts the benchmarks so dramatically that your old targets need updating. If you’re still measuring lead response time in hours, you’re grading on a curve that no longer applies.
6. Lead Response Time
Best for: The single strongest predictor of prospect engagement.
Formula: Average time between prospect inquiry and first meaningful response
Pre-AI baseline: Hours to days
Post-AI benchmark: Under 60 seconds
According to Zillow’s research, responding within 1–2 minutes gives you a 40% chance of prospect engagement. Wait 30 minutes and that drops to 10%. Most leasing offices without AI don’t respond for hours, sometimes days, especially to after-hours inquiries.
This is where AI leasing assistants make the starkest difference. Sub-minute response times aren’t aspirational with AI; they’re the default.
How to measure it: Pull timestamps from your PMS or CRM. Compare the inquiry timestamp to the first reply timestamp. Exclude auto-acknowledgment emails (“We got your message!”) and only count substantive responses that answer the prospect’s question or move them toward a tour.
7. Lead-to-Lease Conversion Rate
Best for: The ultimate measure of leasing funnel effectiveness.
Formula: (Signed leases ÷ Total guest cards or inquiries) × 100
Pre-AI baseline: 8.7% (MyResman industry average). Top performers reach 16.5%.
Post-AI benchmark: 15–30% consistently, with some fully automated workflows reaching 40–50%.
The jump from 8.7% to 40%+ isn’t magic. It comes from eliminating the gaps that kill conversion: slow response, missed follow-ups, inconsistent qualification, and after-hours dead zones. When properties automate showing coordination, inquiry response, and AI lead qualification, every step of the funnel tightens.
Important nuance: Attribution matters. If your AI handles the initial response but a human closes the lease, how do you credit the conversion? Define your attribution model before deployment. Most teams use first-touch attribution for AI (the AI gets credit if it was the first responder) while tracking human involvement as an assist.
8. Days on Market
Best for: Measuring vacancy duration and its direct NOI impact.
Formula: Date unit listed – Date lease signed
Pre-AI baseline: 20–30 days industry average
Post-AI benchmark: 4+ days faster (based on tour booking speed improvements alone)
According to NMHC research, each vacant day in a Class B multifamily property costs $45 to $75. Cutting even 4 days off your average vacancy across a 200-unit portfolio saves $36,000 to $60,000 annually. Showdigs’ 2026 platform data shows leads book tours 4 days sooner with AI, and that’s just the tour scheduling acceleration. Faster response, better qualification, and automated follow-up compress the timeline further.
9. Cost Per Lease
Best for: Capturing the true all-in cost of filling a unit.
Formula: (Total leasing costs: staff time + marketing + AI tools + commissions) ÷ Signed leases
Pre-AI baseline: Varies by market, typically $1,500–$4,000
Post-AI benchmark: 30–50% reduction
This is the metric that separates “AI saved us time” from “AI saved us money.” Include everything: staff hours spent on leasing activities, advertising spend, listing site fees, AI tool subscription costs, and any leasing commissions. The denominator is signed leases, not inquiries or tours. When AI handles the top of the funnel and humans focus on closing, the cost per lease drops because you need fewer staff hours per conversion.
10. Tour Show Rate
Best for: Measuring whether confirmed tours actually happen.
Formula: (Tours completed ÷ Tours scheduled) × 100
Pre-AI baseline: 40–60%
Post-AI benchmark: 70–85%
No-shows waste leasing agent time and delay occupancy. AI confirmation sequences (text reminders 24 hours and 1 hour before the tour, easy reschedule links, and automated follow-up if the prospect doesn’t show) dramatically improve show rates. This is a leading indicator: higher show rates feed directly into higher conversion rates.
Tier 3: AI-Transformed Maintenance KPIs
Maintenance is where AI KPIs in property management get the most tangible. The financial impact of faster resolution, better triage, and fewer unnecessary dispatches flows directly to NOI. AppFolio’s 2026 Benchmark Report found that 55% of property managers cite elevated vacancy as their top threat, and poor maintenance response is one of the primary drivers of tenant turnover.
11. First Response Time
Best for: Measuring how quickly tenants hear back after submitting a maintenance request.
Pre-AI baseline: 4.6 days average for manual systems
Post-AI benchmark: Under 60 seconds for acknowledgment, under 18 hours for substantive action
The gap between 4.6 days and 60 seconds is not a typo. Manual systems require a human to read the request, categorize it, check vendor availability, and respond. AI does all of that instantly. Property Meld’s MAX system, which guides residents through diagnosing maintenance issues, reports 30% faster work order resolutions. Livly’s AI assistant reduced after-hours maintenance calls by 35% for a 500-unit portfolio.
Data consistently shows that tenants whose maintenance requests are resolved within 24 hours renew at rates 15 to 20 percentage points higher than tenants who experience multi-day response times. First response time is a retention metric disguised as an operations metric.
For a deeper breakdown of maintenance workflows, the AI maintenance coordinator guide walks through the full intake-to-resolution pipeline.
12. Mean Time to Resolve (MTTR)
Best for: End-to-end resolution speed, from request to completed repair.
Formula: Average of (Resolution timestamp – Request timestamp) across all work orders
Pre-AI baseline: Property-specific, but multi-day resolution is common
Post-AI benchmark: 25–40% reduction from your baseline
MTTR captures the full lifecycle: intake, triage, vendor assignment, scheduling, repair completion, and tenant confirmation. AI compresses the front end (intake through vendor assignment) from hours or days to minutes. The repair itself still takes however long it takes, but getting the right vendor there faster means the clock runs shorter overall.
13. Maintenance Cost Per Unit
Best for: Tracking the annual maintenance budget on a per-unit basis.
Formula: Total annual maintenance spend ÷ Total units
Pre-AI baseline: $800–$1,500 per year per unit (varies by property class and age)
Post-AI benchmark: 15–20% reduction in Year 1
McKinsey research suggests a 25–30% cost reduction is achievable for data-driven maintenance programs. The savings come from three sources: containment (resolving issues without vendor dispatch), faster triage (preventing small problems from becoming expensive ones), and better vendor matching (sending the right trade the first time).
AI triage also reduces the average cost per repair. The benchmark drop is from $394 to $320 per repair, a savings that compounds across hundreds or thousands of work orders annually.
14. Vendor Dispatch Speed
Best for: Measuring the time from request intake to vendor assignment.
Formula: Vendor assignment timestamp – Request intake timestamp
Pre-AI baseline: Hours to days (depends on office hours and staff availability)
Post-AI benchmark: Under 30 minutes for routine issues, under 5 minutes for emergencies
When AI can pull from your preferred vendor list and automatically assign based on trade type, availability, and location, dispatch becomes nearly instantaneous. This is especially critical for emergencies where a 2-hour delay in dispatching a plumber can turn a $500 repair into a $5,000 one.
Haven’s Maintenance AI dispatches vendors from your preferred lists directly, creating work orders and assignments inside your PMS without human intervention.
For details on automating the vendor dispatch workflow, that guide covers the technical setup.
15. Recurring Issue Rate
Best for: Identifying whether problems are actually getting fixed or just getting band-aided.
Formula: (Work orders for previously reported issues at the same unit ÷ Total work orders) × 100
Target: Declining trend quarter over quarter
A high recurring issue rate means either the initial diagnosis was wrong, the repair was inadequate, or there’s a systemic property issue that needs capital investment rather than repeated repairs. AI can flag recurring issues automatically by matching new requests against historical work orders for the same unit, something that’s nearly impossible to track manually across a large portfolio.
Tier 4: Business-Outcome KPIs (What Ownership Cares About)
These are the metrics that appear in investor reports and board presentations. They’re lagging indicators, meaning they reflect the cumulative impact of all the operational KPIs above. But they’re the ones that determine whether AI investment continues.
16. Net Operating Income (NOI)
Best for: The north-star financial metric for any property investment.
Formula: Gross rental income – Operating expenses
AI impacts NOI from both sides: increasing revenue through faster leasing and higher retention, and decreasing expenses through lower maintenance costs, reduced staff overhead, and fewer vacancy days. Industry research shows AI adoption delivers a 3.7–5.2% average annual increase in portfolio returns.
For operators managing portfolios, the scaling property management guide shows how these NOI improvements compound across hundreds or thousands of units.
17. Occupancy Rate
Best for: The most-watched lagging indicator in multifamily.
Formula: (Occupied units ÷ Total units) × 100
Pre-AI baseline: 90–95% (market-dependent)
Post-AI benchmark: 1–3 percentage point improvement
Occupancy is the result of everything upstream: lead capture, response time, conversion, retention, and turnover speed. Don’t use it as your primary AI KPI because it moves slowly and has too many confounding variables (market conditions, pricing, seasonality). Instead, use the leading indicators above and watch occupancy as confirmation.
18. Tenant Retention / Lease Renewal Rate
Best for: The single most cost-effective revenue metric.
Formula: (Renewed leases ÷ Expiring leases) × 100
Post-AI benchmark: 15–20 percentage points higher than pre-AI baseline
The full cost of a unit turn, including vacancy loss, make-ready expenses, and leasing commissions, runs $2,000 to $5,000 for residential units. Every retained tenant avoids that cost entirely. Data consistently shows the strongest predictor of renewal is maintenance response quality. When AI gets response times under 24 hours, renewals jump.
For strategies on using AI for tenant retention, that guide covers the full playbook beyond just maintenance speed.
19. Tenant Satisfaction Score
Best for: A leading indicator of retention that you can act on before a lease expires.
Measurement: Post-interaction surveys, quarterly NPS, or annual satisfaction surveys
Pre-AI baseline: 72% average across the industry
Post-AI benchmark: 85–94% on AI-automated platforms
Tenant satisfaction jumped from 72% to 94% on properties using AI-automated platforms, according to Oxmaint research. The driver isn’t AI being “friendlier” than humans. It’s AI being available at 11 PM on a Saturday when the toilet overflows, and AI following up three days later to confirm the repair was done right.
20. AI ROI Multiple
Best for: Justifying continued (or expanded) AI investment to ownership.
Formula: (Total value generated by AI: revenue gained + costs avoided) ÷ Total AI tool cost
Industry benchmark: 3x–10x return on tool cost
Payback period: 4–8 months for structured deployments
Most commercial real estate firms achieve full payback on their AI investment within 4 to 8 months. AppFolio’s data shows that property management professionals using AI broadly across core workflows project 31% portfolio growth in 2026, compared to just 12% for those not using AI. That gap is the ROI story in a single statistic.
Calculate your ROI multiple monthly for the first year. Include both hard savings (reduced vendor dispatches, lower marketing spend, fewer staff hours) and soft savings (faster leasing velocity, higher retention, reduced vacancy days).
How to Calculate AI ROI From Property Management KPIs
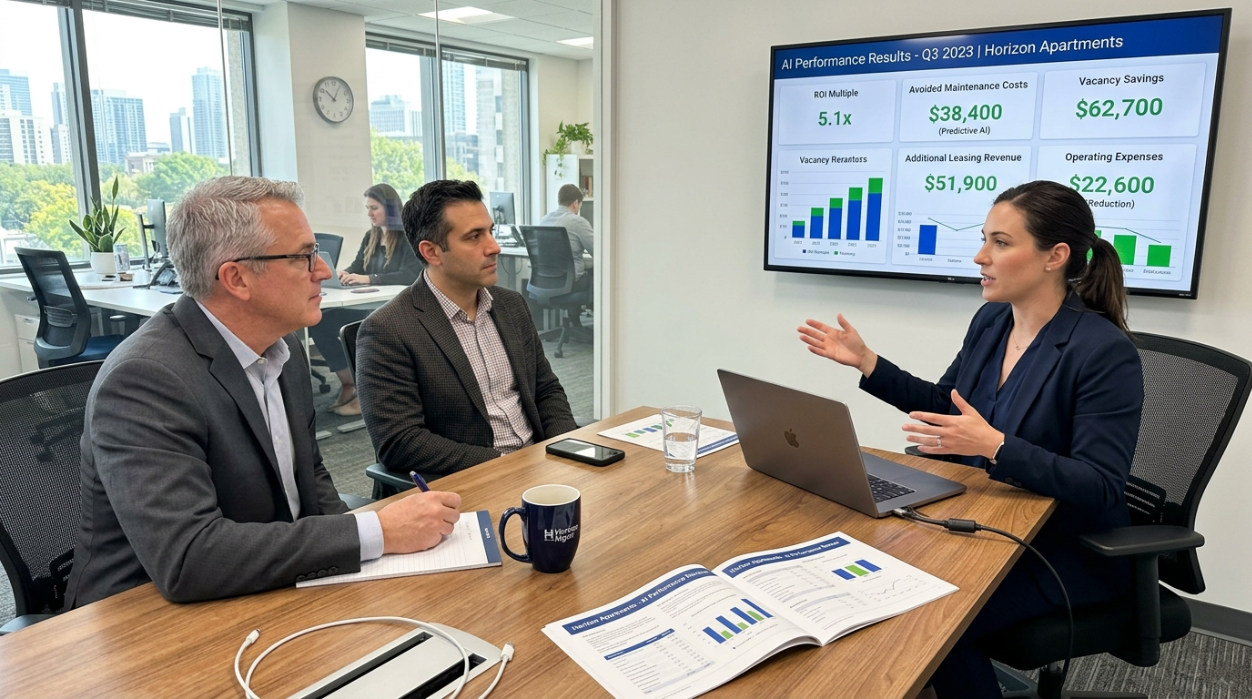
AI ROI should not be calculated from a single metric. Property managers should combine measurable revenue gains, avoided costs, and AI operating costs to determine the financial impact of deployment.
Basic AI ROI Formula
AI ROI Multiple = Total measurable value generated by AI ÷ Total AI cost
Where measurable AI value can include:
Additional leases attributable to faster response and follow-up
Reduced vacancy days
Avoided maintenance dispatches
Reduced maintenance costs
Reduced leasing labor requirements
Reduced overtime or after-hours workload
Improved tenant retention
Other directly measurable cost savings
Example
Assume a 500-unit portfolio generates:
$30,000 in avoided maintenance costs
$25,000 in recovered vacancy value
$20,000 in measurable labor savings
$15,000 in additional leasing contribution
Total measurable value = $90,000
If AI costs $18,000 for the same period:
AI ROI Multiple = $90,000 ÷ $18,000 = 5.0x
The important step is attribution. Compare the AI-enabled period with a documented pre-AI baseline and control for seasonality, occupancy changes, pricing changes, staffing changes, and major market shifts whenever possible.
Do Not Count the Same Benefit Twice
For example, if faster response produces an additional lease, do not also count the entire resulting occupancy improvement as a separate revenue benefit unless the calculation isolates an incremental effect. A defensible AI ROI model should use conservative attribution rather than adding every positive KPI together.
What Should an AI Property Management KPI Dashboard Include?
A practical AI KPI dashboard should have four layers:
Layer 1: AI performance
Automation rate, triage accuracy, containment rate, false emergency rate.
Layer 2: Workflow performance
Lead response time, vendor dispatch speed, first response time, mean time to resolve.
Layer 3: Property outcomes
Lead-to-lease conversion, days on market, occupancy, maintenance cost per unit, tenant satisfaction, retention.
Layer 4: Financial outcomes
NOI impact, avoided costs, incremental revenue, AI operating cost, ROI multiple, and payback period.
This structure prevents the dashboard from becoming a collection of AI activity statistics. Every AI metric should eventually connect to an operational or financial outcome.
How to Set Up Your AI KPI Dashboard
Tracking 20 KPIs sounds overwhelming. It doesn’t have to be. Follow this implementation sequence.
Step 1: Pull 90 days of baseline data before deploying AI. This is non-negotiable. Track your current lead response time, conversion rate, maintenance response time, cost per unit, and satisfaction scores. Without baselines, every post-AI number is just a number, not proof of improvement.
Step 2: Choose 3–5 KPIs per workflow. You don’t need all 20 from day one. Pick the ones most relevant to your biggest pain points. Losing leads after hours? Prioritize after-hours capture rate, lead response time, and conversion rate. Maintenance costs out of control? Start with triage accuracy, containment rate, and cost per unit.
Step 3: Establish a reporting cadence.
Weekly: Lead response time, after-hours capture rate, AI automation rate, first response time. These are leading indicators that move fast and signal problems early.
Monthly: Lead-to-lease conversion, maintenance cost per unit, MTTR, tenant satisfaction, containment rate.
Quarterly: NOI impact, occupancy rate, tenant retention, AI ROI multiple, recurring issue rate.
Step 4: Require PMS integration. Your AI tool must read and write to your property management system. If it can’t create work orders, log interactions, and update tenant records automatically, you’ll spend hours pulling data manually, which defeats the purpose. This is where AI property management software that integrates directly with your PMS becomes the measurement backbone, not just an operational tool.
Step 5: Compare against the benchmarks in this article. If your post-AI numbers aren’t reaching the benchmarks above after 6 months, the issue is usually one of three things: poor data quality going into the AI, broken workflow orchestration between AI and human handoffs, or an AI tool that isn’t purpose-built for property management.
90-Day AI KPI Implementation Plan
Days 1–30: Establish the Baseline
Pull 90 days of historical data where available.
Define every KPI and its calculation.
Identify the three most important workflows.
Document current labor, maintenance, leasing, and vacancy costs.
Confirm which data is available through the PMS and CRM.
Primary goal: Know what "before AI" actually looks like.
Days 31–60: Launch and Validate
Deploy the AI workflow.
Track AI-native metrics such as automation, containment, and triage accuracy.
Review exceptions and human handoffs weekly.
Compare AI-assisted and non-AI interactions.
Check data quality and PMS synchronization.
Primary goal: Verify that the AI is performing correctly before optimizing for scale.
Days 61–90: Connect KPIs to Financial Outcomes
Compare post-AI performance with the baseline.
Calculate avoided costs and incremental revenue.
Measure changes in vacancy, conversion, maintenance costs, and labor time.
Calculate AI ROI.
Identify which workflows should be expanded, redesigned, or discontinued.
Primary goal: Demonstrate whether AI is creating measurable business value.
Where Should Property Managers Get AI KPI Data?
The best source depends on the KPI. Property managers should avoid relying entirely on the AI vendor's own dashboard because independent PMS, CRM, leasing, maintenance, and financial data can provide a more complete view.
KPI | Primary Data Source |
|---|---|
Lead Response Time | CRM, leasing platform, communications system |
Lead-to-Lease Conversion | CRM/PMS |
After-Hours Capture Rate | Phone, messaging, CRM |
Tour Show Rate | Leasing/tour scheduling system |
Triage Accuracy | Maintenance platform + human verification |
Containment Rate | AI platform + maintenance work orders |
Vendor Dispatch Speed | Maintenance platform |
Mean Time to Resolve | Maintenance/work-order system |
Maintenance Cost Per Unit | Accounting/PMS |
Occupancy | PMS |
Tenant Retention | PMS |
Tenant Satisfaction | Survey/CRM platform |
NOI | Accounting/PMS |
AI Cost | Vendor invoices/contracts |
AI ROI | Combined operational + financial data |
Whenever possible, preserve the original event timestamps rather than relying only on monthly summary reports. Timestamp-level data makes response-time, automation, and resolution calculations much more reliable.
After 90 Days
Move from implementation reporting to continuous optimization. Review operational KPIs weekly, business outcomes monthly, and financial ROI quarterly.
Common Measurement Mistakes to Avoid
Tracking occupancy as your AI attribution metric. Occupancy is influenced by too many external factors (market rents, seasonality, local supply). Use it as a confirmation metric, not your primary AI KPI.
Ignoring the handoff gap. If your AI responds to a leasing inquiry in 8 seconds but the human follow-up takes 3 days, your lead response time looks great on the AI dashboard but terrible in reality. Measure end-to-end, not just the AI’s portion.
Measuring monthly instead of weekly in the first 90 days. AI systems improve through feedback loops. If you only check numbers monthly, you miss the opportunity to course-correct calibration issues early.
Forgetting to track what AI saves in staff hours. Industry data suggests AI saves property managers 10 or more hours per week. That time has real value. If your team reinvests those hours into resident events, lease renewals, or property inspections, track the outcomes of that reinvestment too. The property manager burnout guide covers why this matters beyond just the numbers.
How Reliable Are AI Property Management Benchmarks?
AI property management benchmarks should be treated as reference points rather than universal performance guarantees. Results vary by property type, unit count, market, staffing model, PMS, AI implementation quality, lead volume, maintenance complexity, and baseline performance.
The most useful benchmark is often your own pre-AI baseline.
Use external benchmarks to answer:
Is our performance broadly competitive?
What target should we test?
Where does our workflow appear unusually weak?
What improvement would justify continued investment?
Use your internal baseline to answer:
Did AI actually improve our performance?
How much value did the improvement create?
Which AI workflow produced the improvement?
Should we expand or change the deployment?
Best practice: label every benchmark in your dashboard as either an external industry benchmark, vendor-reported result, recommended operating target, or internal portfolio benchmark. Do not treat these categories as interchangeable.
FAQ
What are AI-native KPIs in property management?
AI-native KPIs are metrics that only exist when AI is part of the workflow. Examples include triage accuracy rate (how often AI correctly classifies maintenance severity), containment rate (issues resolved without vendor dispatch), after-hours capture rate, and AI automation rate. These have no pre-AI equivalent because manual processes can’t generate this data.
How long does it take to see ROI from AI in property management?
Most property management firms achieve full payback on AI investment within 4 to 8 months when deployment is structured properly. The industry benchmark is a 3x to 10x return on AI tool cost, driven by faster leasing, lower maintenance costs, and higher tenant retention. Baseline measurement before deployment is essential to proving this ROI.
What is a good lead-to-lease conversion rate with AI?
The industry average without AI is 8.7% of guest cards converting to signed leases. Top-performing teams without AI reach about 16.5%. With AI handling lead response, qualification, follow-up, and tour scheduling, conversion rates consistently reach 15–30%, with some fully automated workflows reporting 40–50%.
How should property managers measure AI maintenance performance?
Focus on five metrics: triage accuracy (target 90%+), containment rate (15–25%), first response time (under 60 seconds for acknowledgment), mean time to resolve (25–40% reduction from baseline), and maintenance cost per unit (15–20% reduction in Year 1). Together, these capture both the quality and efficiency of AI-driven maintenance.
What’s the difference between AI automation rate and containment rate?
AI automation rate measures the percentage of all interactions (leasing and maintenance) handled end-to-end without human involvement. Containment rate is maintenance-specific and measures how often AI-guided troubleshooting resolves an issue without dispatching a vendor. A high automation rate means fewer human handoffs overall; a high containment rate means fewer repair costs specifically.
How often should AI KPIs be reviewed?
Weekly for operational leading indicators (lead response time, after-hours capture rate, first response time). Monthly for workflow outcomes (conversion rate, maintenance cost per unit, tenant satisfaction). Quarterly for business-level results (NOI impact, retention rate, AI ROI multiple). During the first 90 days after deployment, weekly reviews across all categories are recommended to catch calibration issues early.
Do I need to track all 20 KPIs from day one?
No. Start with 3–5 KPIs per workflow that align with your biggest operational pain points. If leasing is your priority, focus on lead response time, conversion rate, and after-hours capture rate. If maintenance is the problem, start with triage accuracy, containment rate, and first response time. Expand to the full framework as your AI deployment matures.
Can AI KPIs work with any property management system?
The KPIs themselves are system-agnostic, but measuring them automatically requires your AI tool to integrate with your PMS. Without read-write PMS integration, you’ll be pulling data manually, which creates lag and inaccuracy. When evaluating AI vendors, ask specifically which KPIs their platform reports on natively and whether those reports pull directly from your PMS data.
See how Haven’s AI agents track and report these KPIs automatically through direct PMS integration.